MỤC LỤC
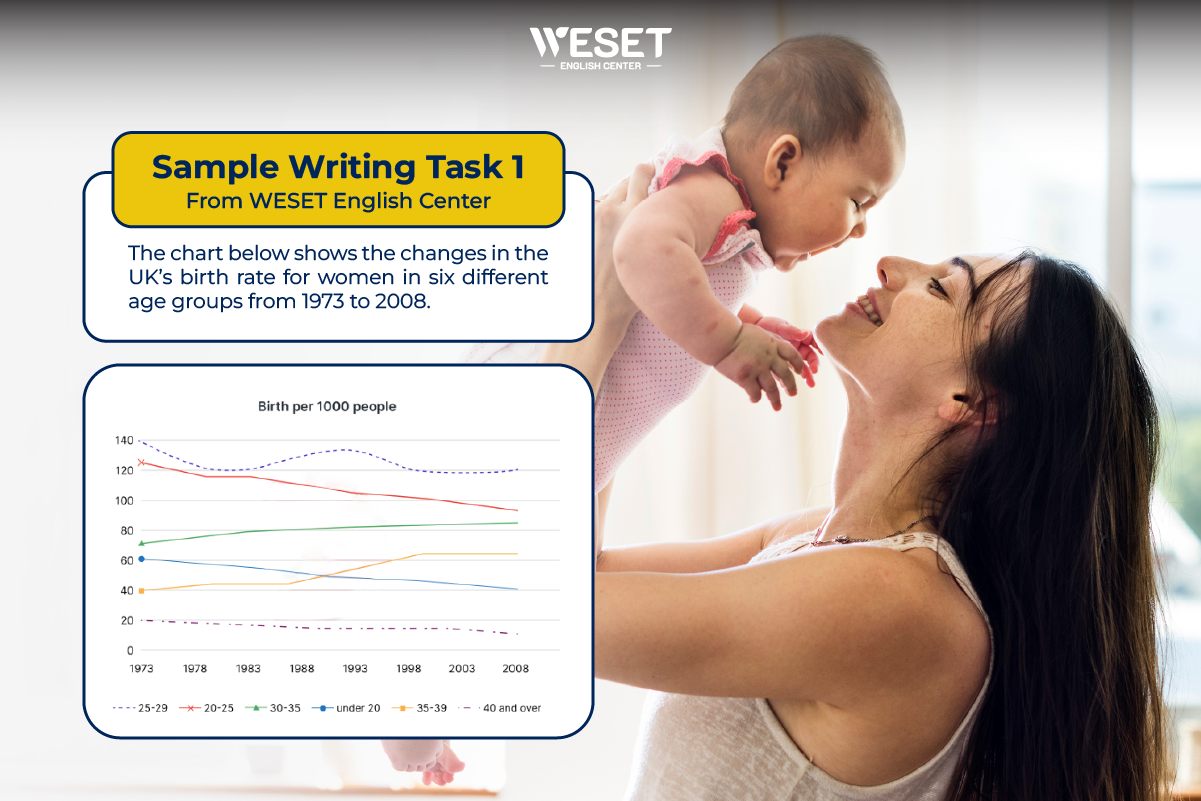
The chart below shows the changes in the UK’s birth rate for women in six different age groups from 1973 to 2008. Summarize the information by selecting and reporting the main features, and make comparisons where relevant.
Trong chuỗi Writing samples lần này, WESET gợi ý bạn cách giải đề dạng bài Line chart. Tham khảo hướng dẫn của WESET để làm Writing task 1 chủ đề Birth và ghi lại những bài học đúc kết của bạn nhé.
BÀI MẪU WRITING TASK 1 – DẠNG LINE CHART | CHỦ ĐỀ: BIRTH
Introduction: Paraphrase lại đề bài
Năm 1973, tỉ lệ sinh của phụ nữ 25-29 tuổi là cao nhất (140 ca sinh trên 1000 phụ nữ), theo sau đó là tỉ lệ sinh của phụ nữ 20-25 tuổi (gần 130 ca sinh)
Ngược lại, tỉ lệ sinh của phụ nữ dưới 20 và 30-35 thấp hơn (khoảng 60-70 ca sinh)
Tỉ lệ sinh của phụ nữ 35-39 đặc biệt thấp (40 ca sinh) và gấp đôi tỉ lệ sinh của phụ nữ 40 tuổi trở lên
Từ năm 1973 đến năm 2008, tỉ lệ sinh của phụ nữ 25-29 tuổi dao động và dừng lại ở con số 120 ca sinh trên 1000 phụ nữ vào năm 2008, giữ vững vị trí cao nhất, trong khi tỉ lệ sinh của phụ nữ 20-25 tuổi chứng kiến 1 sự lao dốc mạnh xuống khoảng trên 90 ca sinh vào năm 2008
Tỉ lệ sinh của phụ nữ dưới 20 và trên 40 cũng chứng kiến xu hướng tương tự, nhưng sự sụt giảm không đáng kể bằng (lần lượt giảm xuống 40 và 10 ca sinh)
Ngược lại, tỉ lệ sinh của phụ nữ 30-35 và 35-39 chứng kiến 1 sự tăng trưởng (lần lượt là 90 và 70 ca sinh vào năm 2008)
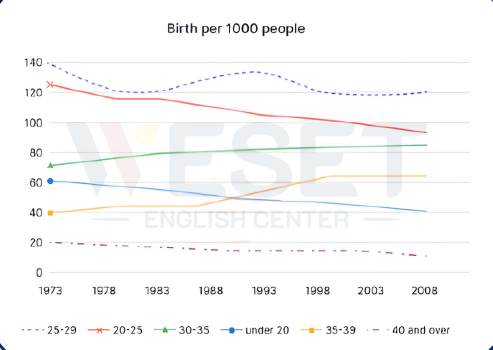
Biểu đồ Writing dạng Line | Chủ đề: Birth
Overall, it is noteworthy that the birth rate for middle-aged women (those between 30 and 39) consistently increased, whereas that for the other age categories decreased. Despite fluctuations, women between the ages of 25 and 29 still made up the majority of the nation’s births, while women over 40 had the lowest rates over this time.
With about 140 births per 1,000 women in 1973, women between the ages of 25 and 29 had the highest birth rate, closely followed by those between the ages of 20 and 25, who had over 130 births. Conversely, the birth rates for women under 20 and those between 30 and 35 were significantly lower, at around 60 and 70 births per 1,000 women, respectively. Women between 35 and 39 had a much lower birth rate – 40 births, twice that of women over 40.
Between 1978 and 2003, the birth rate among women aged 25 to 29 varied between 120 and 130 births, but it ended the period at 120 births per 1,000 women, keeping it at the top of all age groups. In the meantime, the birth rate for women between the ages of 20 and 25 fell precipitously, reaching just over 90 births in 2008. Similar but less dramatic drops were reported among women under 20 and those over 40, with birth rates dropping to 40 and 10 births, respectively. In contrast, the birth rates of women between the ages of 30 and 35 and 35 and 39 increased substantially, reaching around 90 and 70 births by 2008, accordingly.
(280 words)
Các bài mẫu IELTS Writing Task 1 bạn có thể quan tâm:
Bài mẫu Writing Task 1 dạng Biểu đồ cột (Bar chart)
Bài mẫu Writing Task 1 – Dạng Bar Chart | Chủ đề: Airline