Bài mẫu Writing Task 1 – Dạng Line Graph | Chủ đề: Population
- WESET
- Bài mẫu IELTS Sample Writing, Bài mẫu Task 1 IELTS Writing sample, Bài thi IELTS mẫu, Blog, Blog IELTS
MỤC LỤC
Những bài Line graph trước đây thường chỉ nói đến thời gian ở quá khứ, nhưng đề bài sau đây lại đề cập thêm năm ở tương lai. Với dạng bài mới này, bạn sẽ làm như thế nào? Bạn hãy tham khảo bài mẫu sau để có thể có hướng làm bài đúng nhất nhé!
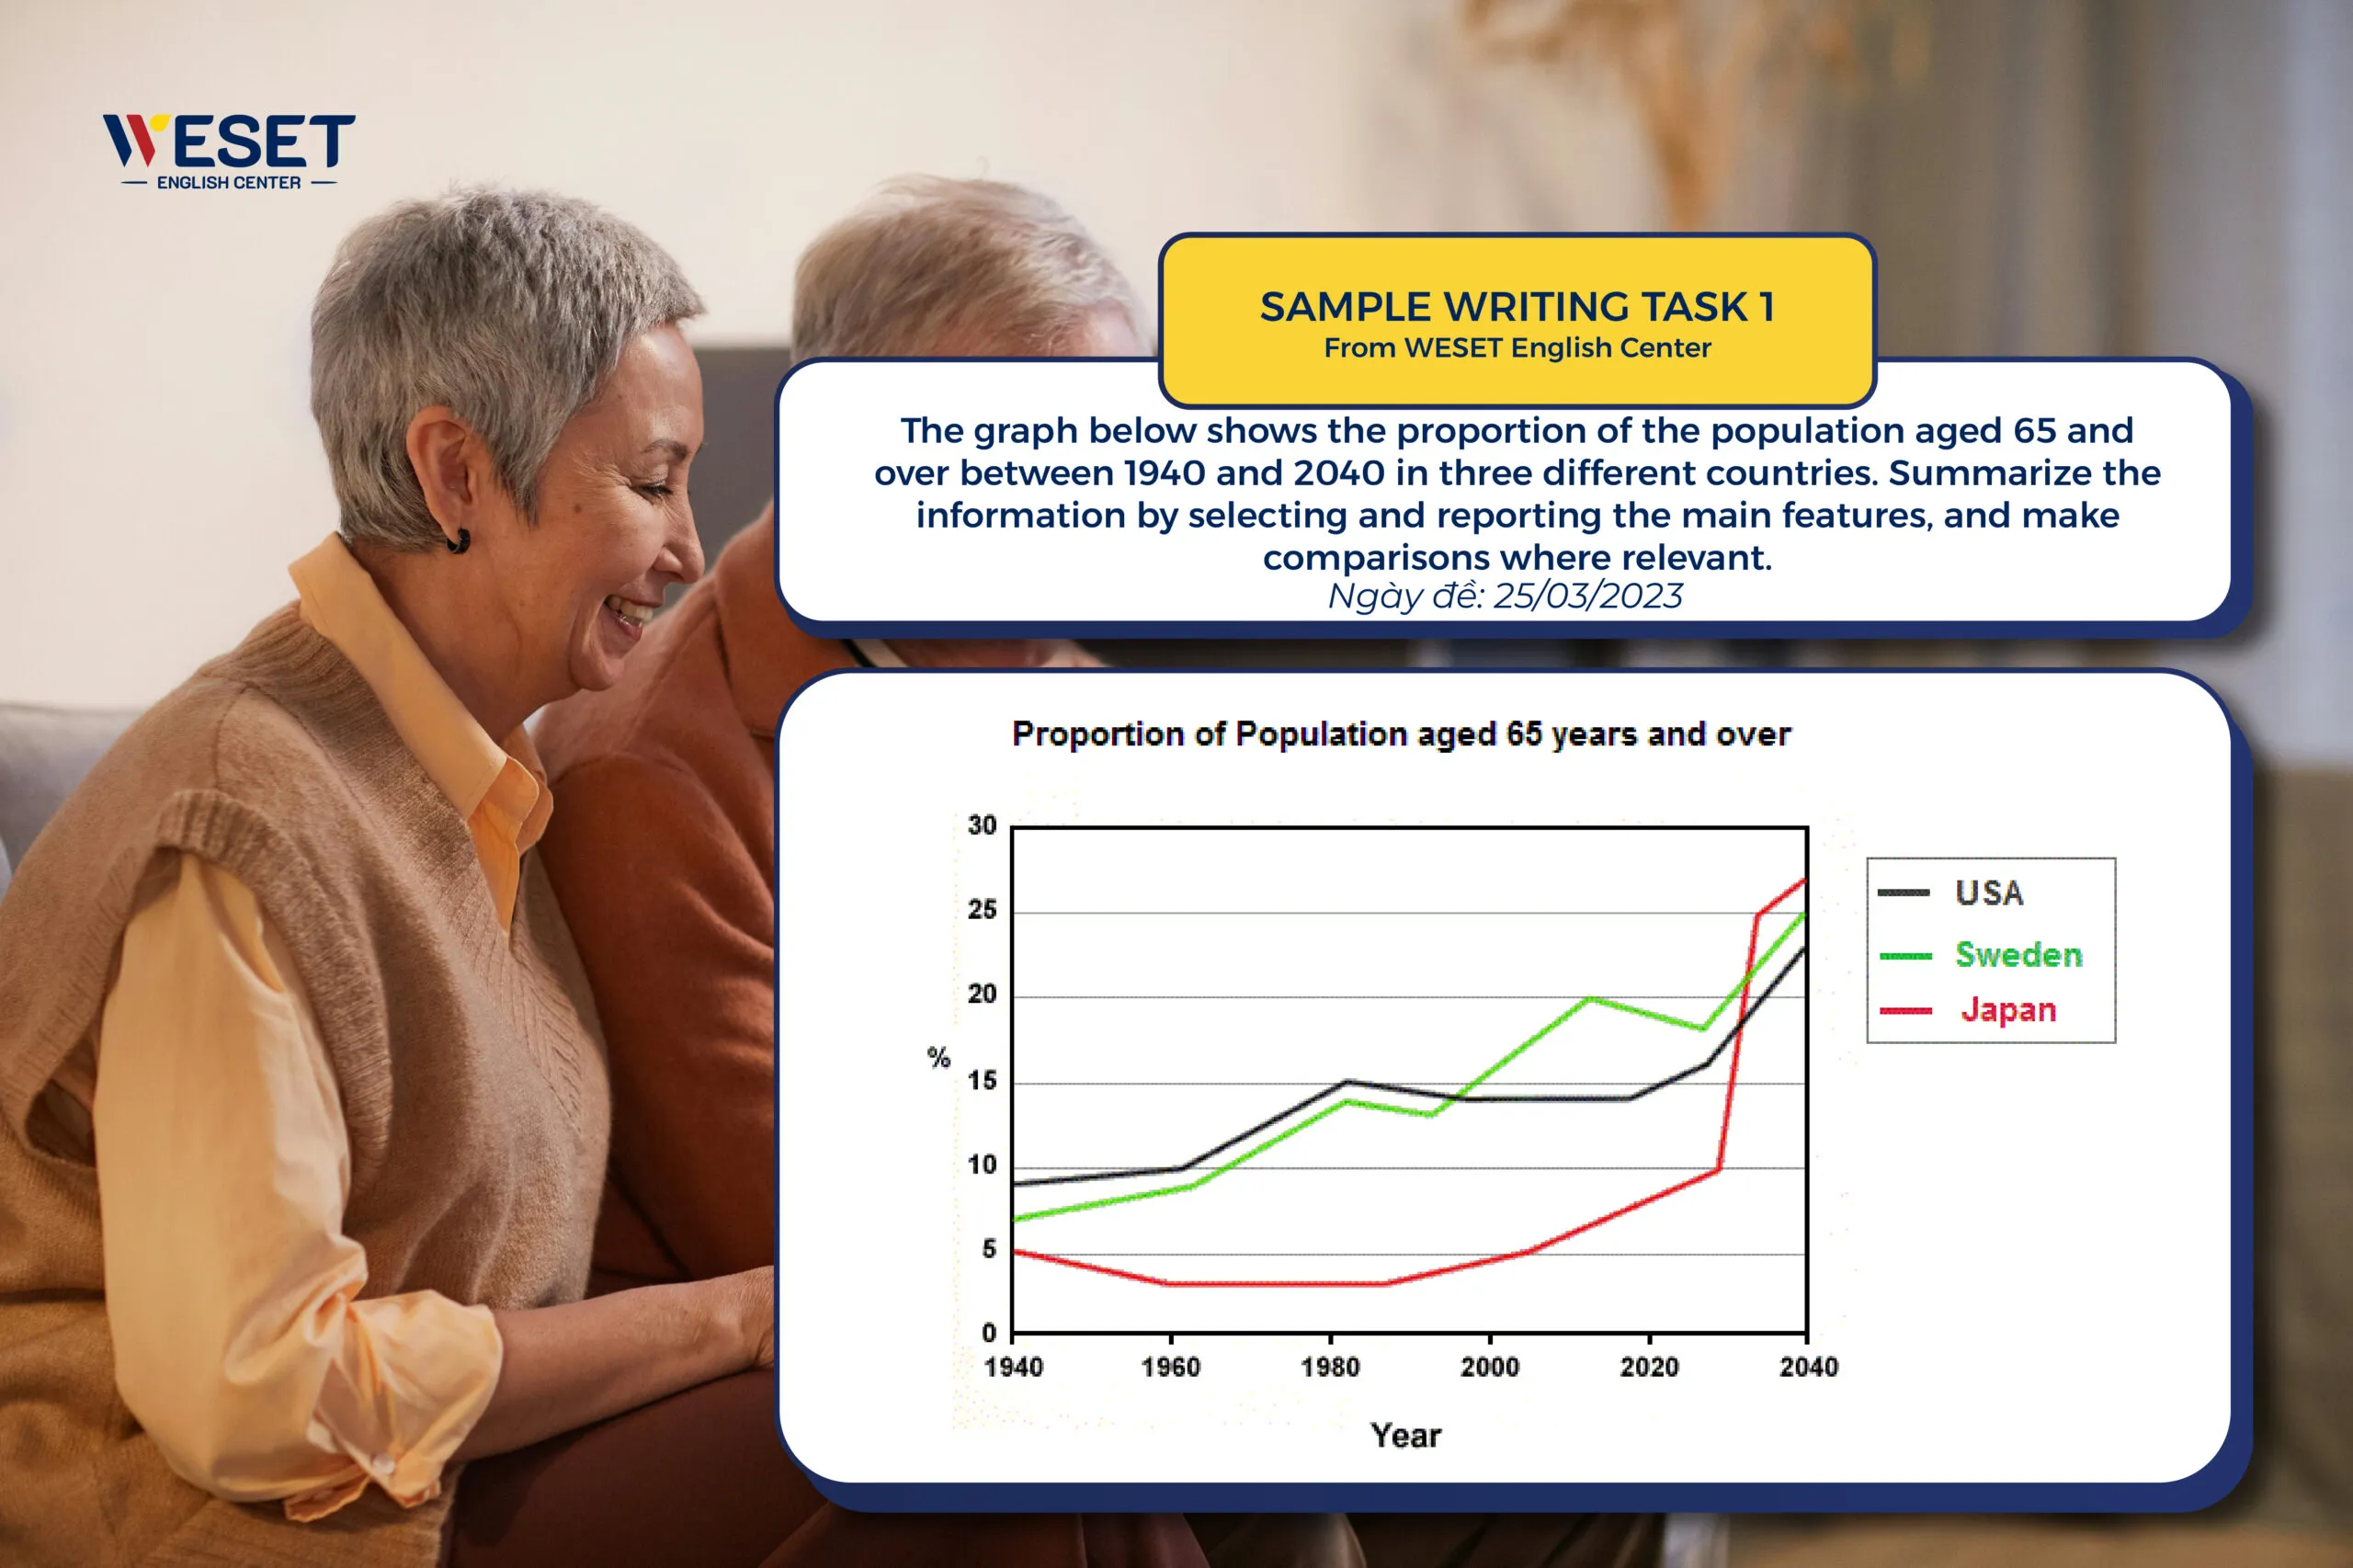
Đề bài: The graph below shows the proportion of the population aged 65 and over between 1940 and 2040 in three different countries. Summarize the information by selecting and reporting the main features, and make comparisons where relevant.

Bài mẫu IELTS Writing Task 1 – Biểu đồ mô tả tỷ lệ dân số từ 65 tuổi trở lên trong khoảng thời gian từ 1940 đến 2040 ở ba quốc gia khác nhau.
1. OUTLINE:
Introduction: Paraphrase the task question
Overview: Cả ba quốc gia đều có xu hướng tăng trong phần trăm dân số người cao tuổi trong cả thế kỷ. Đặc biệt, Nhật Bản được dự đoán là sẽ có tỷ lệ vượt quá 30% và là đất nước có tỷ lệ người cao tuổi cao nhất vào năm 2040.
Body paragraphs:
Body 1: Mỹ và Thụy Điển
- Cả hai quốc gia này bắt đầu từ mức dưới 10% vào năm 1940.
- Mỹ và Thụy Điển duy trì một sự tăng trưởng nhẹ nhàng qua các thập kỷ.
Body 2: Nhật Bản
- Từ năm 1940 đến khoảng năm 2000, tỷ lệ dân số cao tuổi của Nhật Bản duy trì ở mức dưới 20%.
- Sau năm 2000, có một sự gia tăng đáng kể, và vào năm 2040, hơn một phần ba dân số Nhật Bản sẽ ở độ tuổi 65 trở lên.
2. Sample Essay
The graph illustrates the proportion of individuals aged 65 and over in the USA, Sweden, and Japan from 1940 to a projection in 2040. Overall, all three countries display an upward trend in the percentage of their elderly population over the century. Japan’s percentage exhibits a remarkable increase, especially after the year 2000, and it is anticipated to have the highest proportion by 2040, soaring beyond 30%.
In 1940, all three nations started with less than 10% of their population being 65 or older. The USA and Sweden maintained a gradual increase over the decades. By 2040, the USA’s percentage is forecasted to approach 20%. Sweden, after a period of stability in around 1980, observes a steeper rise, aligning closely with the USA’s trajectory.
Japan, however, presents a distinct pattern. From 1940 until about 2000, Japan’s elderly demographic remained below 20%, much lower than the other two countries. But after that, there’s a dramatic surge, and by 2040, over one-third of Japan’s population is projected to be aged 65 or older, significantly surpassing both the USA and Sweden.
(178 words)
3. Highlighted Vocabulary:
Exhibits (v): trưng bày, thể hiện
Forecasted (v): dự đoán
Trajectory (n): quỹ đạo, đường đi
Demographic (n): nhóm dân số.
Có thể bạn quan tâm:
Bài mẫu Writing Task 1 – Dạng Map | Chủ đề: Museum
Giải đề mẫu Writing Task 1 dạng Process Perfume Oil | Đề ngày 13/10/2022
Giải đề mẫu Writing Task 1 – Dạng Line Graph | Chủ đề: Crimes


