Bài mẫu Writing Task 1 – Dạng Mixed Chart | Chủ đề: University degree & Salary
- WESET
- Bài mẫu IELTS Sample Writing, Bài mẫu Task 1 IELTS Writing sample, Bài thi IELTS mẫu, Blog, Blog IELTS
MỤC LỤC
Đến với chuỗi ôn tập Writing Task 1 hôm nay, WESET gửi đến bạn một đề bài dạng Mixed Chart cùng bài giải từ WESET. Hãy ghi chú kỹ lưỡng để tích lũy thêm kiến thức nhé!
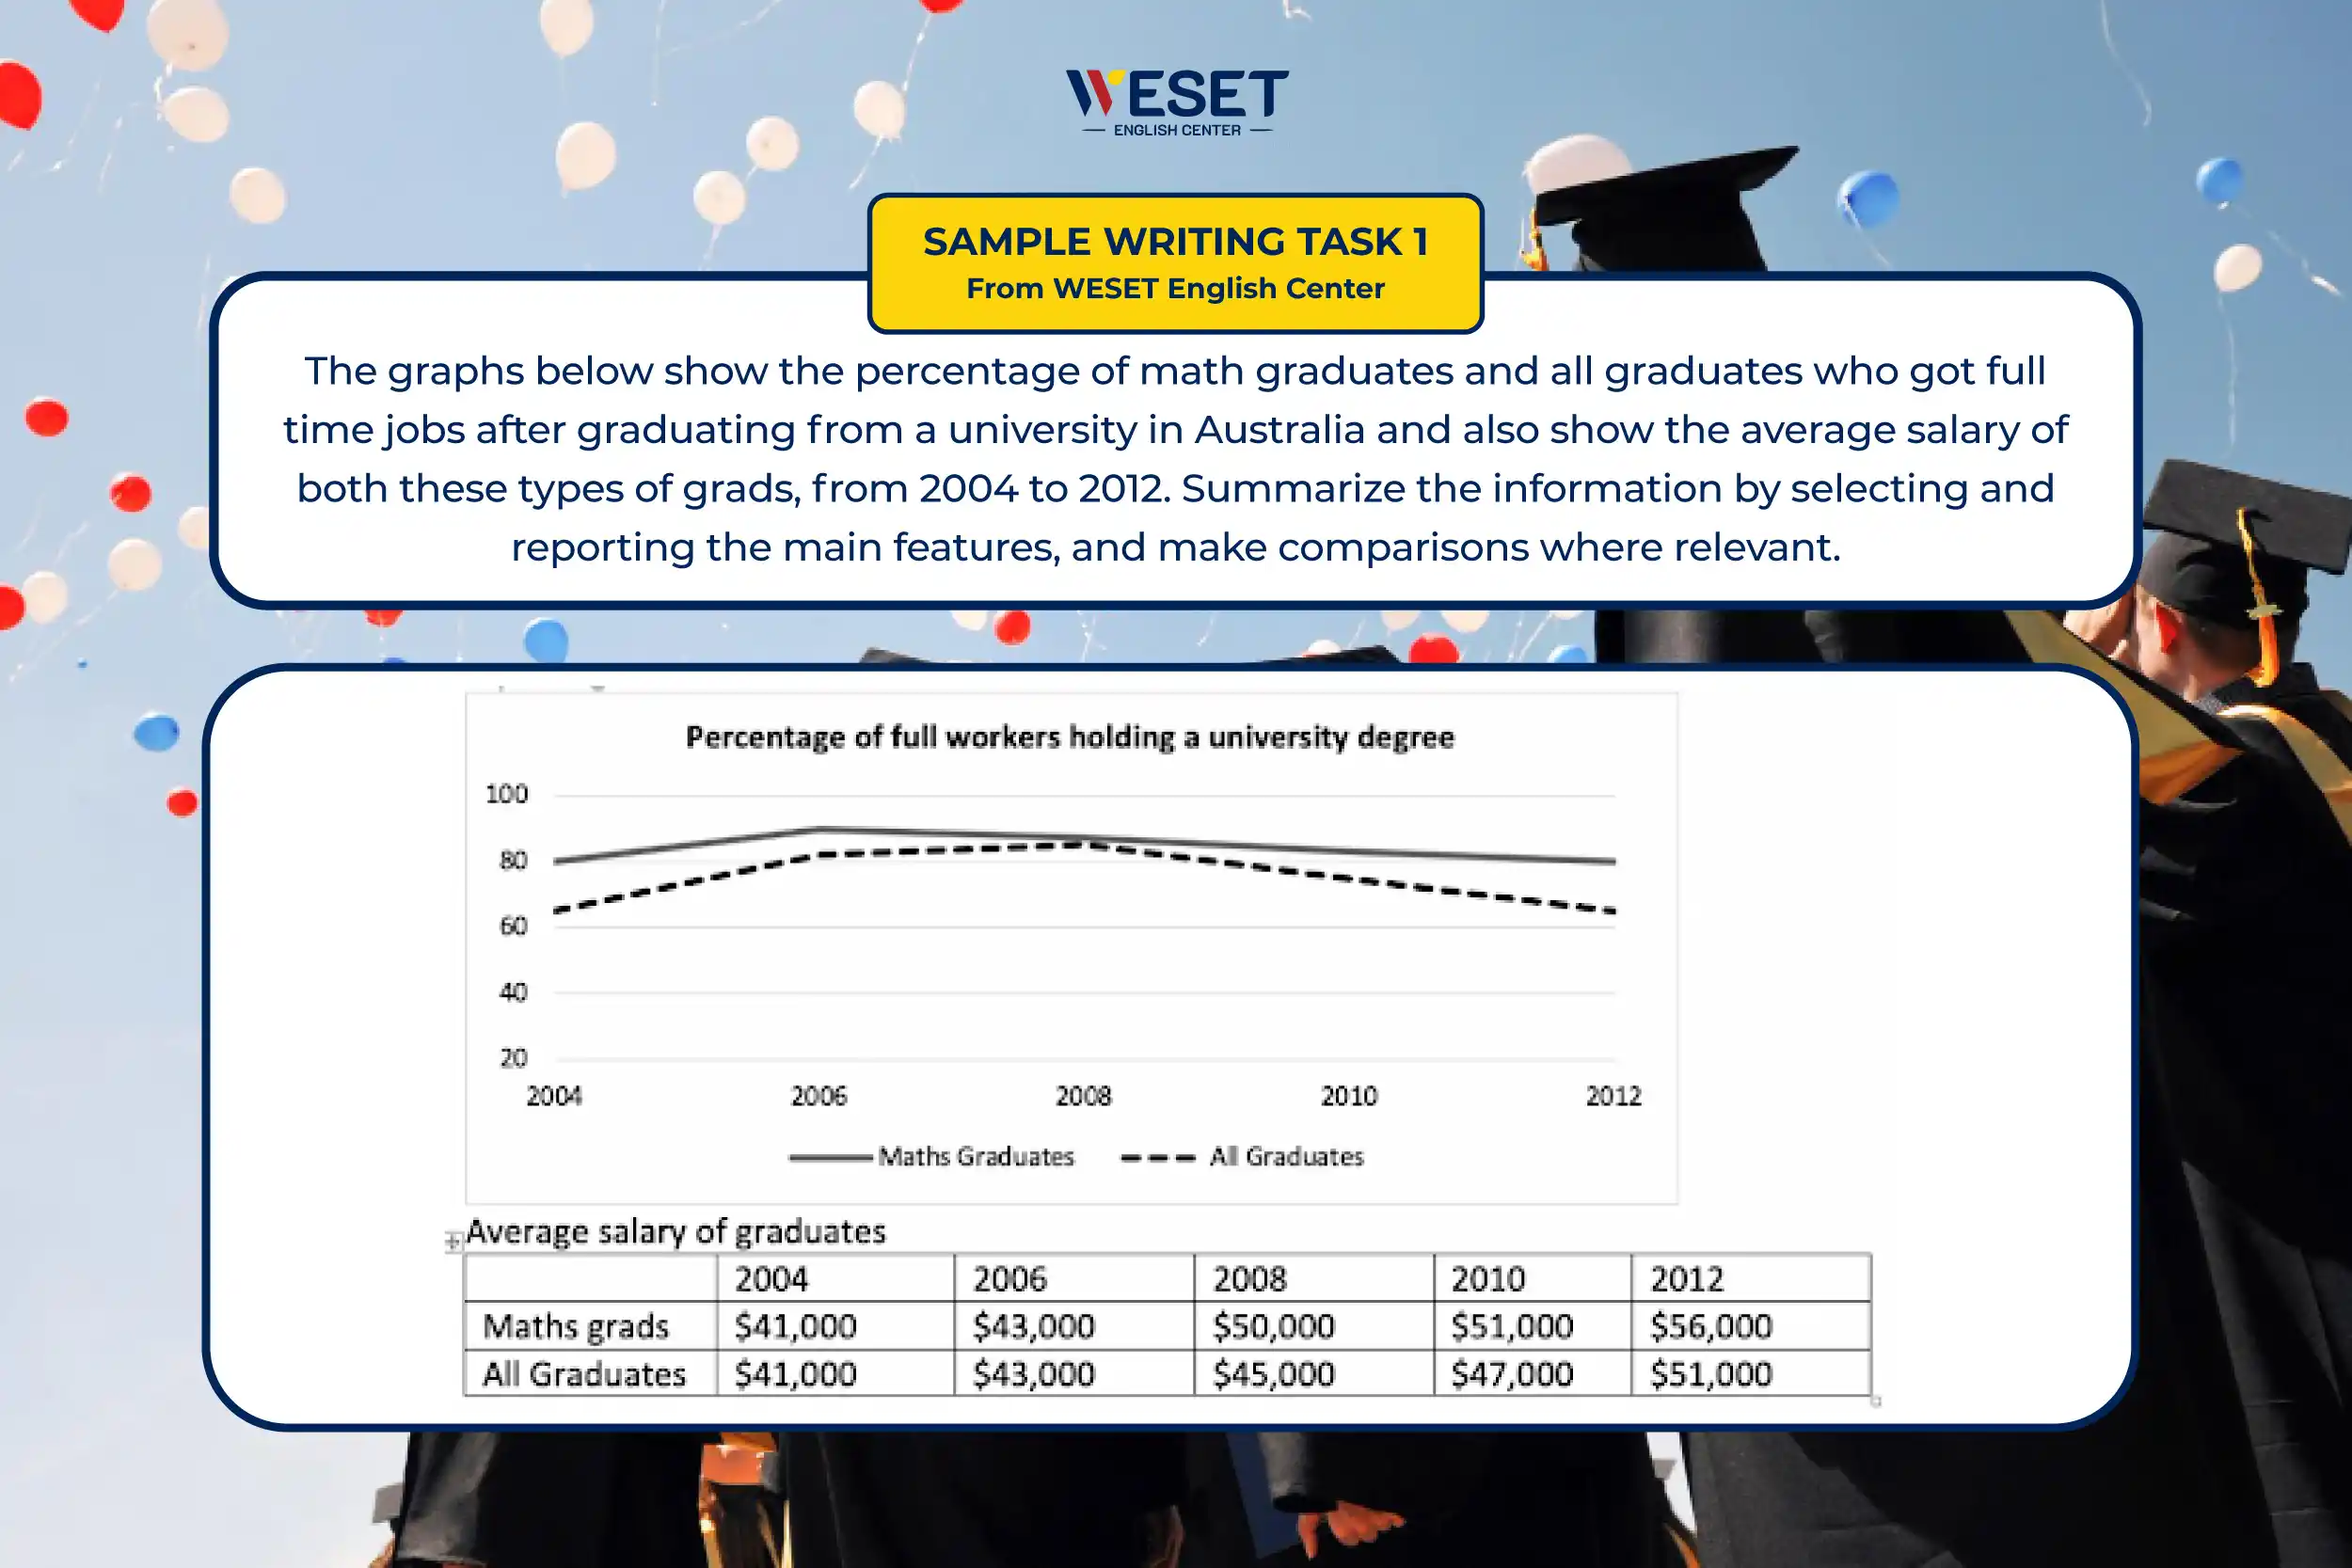
Đề bài: The graphs below show the percentage of math graduates and all graduates who got full time jobs after graduating from a university in Australia and also show the average salary of both these types of grads, from 2004 to 2012.

IELTS Writing Task 1: Dạng Mixed Chart gồm Line graph và Table
1. Dàn bài
Introduction: Paraphrase lại đề bài
Overview:
- Line graph: Nhiều math graduates có full-time jobs hơn graduates các ngành khác
- Table: Lương math graduates tăng mạnh hơn so với lương của các graduates khác
Body 1: Line graph
- 2004: Math là 80%, tức 15% higher
- 2006: Cùng tăng khoảng 12%
- Math giảm đều đến 80% năm 2012 trong khi all graduates chạm đỉnh năm 2008 trước khi giảm xuống 65% năm 2012
Body 2: Table
- 2 năm đầu bằng nhau
- Từ 2008 đến 2012: Math cao hơn, tăng mạnh còn all graduates tăng nhẹ
2. Bài mẫu
The provided line graph compares the proportion of graduates from math and other majors who could have a full-time job after their graduation from 2004 and 2012 while the table shows how their salary changed throughout that period of time.
Overall, it is readily apparent that the percentage of full-time employees graduating from the math department was always higher than that of others. Moreover, although all graduates experienced an upward trend in their salary, it was the ones from Math who got the higher amount of money.
As regards the line graph, around 80% of full-time employees in 2004 graduated from Math faculty, which was 15% higher than the figure of one from other departments. Two years later, both data experienced a slight increase of 10%. After that, while the percentage of math graduates declined marginally to end at 80% in the last year, that of other graduates grew slightly to hit a peak of 85% in 2008 before dropping gradually to under 70% in 2012.
With regard to the table, both the salaries of math and other graduates started at 41000 dollars in 2004 and grew 2000 more dollars two years later. After that, however, that of math graduates was higher than others. In particular, a significant increase of 13000 dollars was witnessed in the former whereas there was a slow rise of 8000 dollars in the latter in the last year surveyed. (232 words)
3. Từ vựng
- Readily apparent (a): Dễ dàng nhận thấy
- Marginally (adv): Ít, nhẹ
- Hit a peak of [data]: Chạm đỉnh
- The former- the latter (n): Cái được nhắc đến trước- cái được nhắc đến sau
Có thể bạn quan tâm
IELTS Writing Task 1 Process/ Diagram: Hướng dẫn cách viết & Bài mẫu chi tiết
Giải đề mẫu Writing Task 1 – Dạng Biểu đồ kết hợp (Mixed chart)
Giải đề mẫu Writing Task 1 dạng Process Perfume Oil | Đề ngày 13/10/2022


